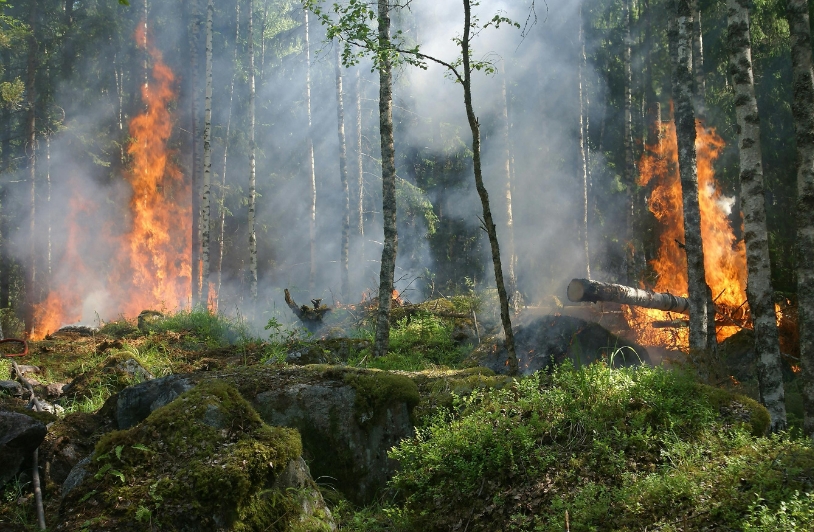
When Florida wildfires rage, smoke can hide their actual size and direction. Ground crews see only what’s right in front of them, but miles above, satellites capture the whole picture. This totally changes how we handle the hundreds of fires that threaten the state each year.
Before, during, and after fires, satellites provide critical intelligence: spot danger zones, map active fires through thick smoke, and assess the damage done. The latest satellite imagery analysis with EOSDA LandViewer reveals burn severity by detecting how different light waves bounce off healthy versus burned vegetation. This technology doesn’t just show what burned but helps predict what might burn next and guides recovery efforts where they matter most.
Florida’s Wildfire Situation
Florida has one of the highest numbers of wildfires in the US. The fire season peak is from April to June, but fires are burning throughout the year. Long dry spells, rising temperatures, and gusty winds increase the chances of fires starting and spreading fast. Wildfires are becoming more frequent as the state faces longer dry seasons and ongoing drought conditions.
Florida’s dry season — from October to May — leaves plants dry and fuels fire risk. During this time, the lack of rain dries out vegetation, creating more fuel for fires. Weather events like cold fronts can bring gusty winds that help fires spread quickly, which is why “red flag warnings” are often issued.
As of early 2025, over 600 wildfires have already burned more than 8,700 acres across the state. Most of the active fires are in northern Florida, with a few in the panhandle and south. The largest current fire is in Gilchrist County, covering 340 acres. Several others range from small brush fires to larger events that require ongoing containment.
While many wildfires are caused by human actions, weather plays a major role in how far and fast they spread. To reduce the threat, Florida carries out prescribed burns across millions of acres each year — controlled fires that help clear dry brush and lower the risk of large wildfires. But as drought becomes more common and development expands into wildland areas, the danger from wildfires continues to grow.
How Satellite Data Helps Track Wildfires
Up-to-date satellite images give fire managers a crucial advantage: the big picture. Ground crews see only what’s directly around them; satellites capture entire fire zones in seconds.
Before fire season, satellites monitor forest conditions, spotting dangerous fuel buildups and drought-stressed trees. Regularly updated satellite images track lightning strikes in remote areas and can detect unusual heat spots that might signal hidden smoldering. With this advanced knowledge, firefighting resources can be put where they’ll be most useful.
During active fires, thermal satellites peer through thick smoke, revealing crucial details ground teams can’t see — like which direction fire lines are moving, where spot fires have jumped containment, and which communities face immediate danger. Updated several times daily, satellite images guide evacuation decisions and firefighter assignments with lifesaving precision.
After flames die down, satellites continue their work, measuring burn severity across the area. Unlike ground surveys that might take weeks, satellite assessments deliver complete damage maps within hours, showing which watersheds face erosion risks and which wildlife habitats need immediate restoration.
Perhaps most valuable is how up-to-date satellite imagery connects the dots between fires. Tracking patterns across seasons and regions with satellites reveals which forest management approaches actually work, helping us prepare better for future fire seasons everywhere.
EOSDA LandViewer: Measuring What Florida Fires Left Behind
While firefighters work on the ground in Florida, scientists use satellite images to track wildfire damage from above. EOSDA LandViewer, an online platform that provides access to the most up-to-date satellite images and geospatial analysis, has become an important tool in this work. The platform combines an easy-to-use interface with a wide range of satellite sources — from Sentinel and Landsat missions to high-resolution imagery from commercial satellites.
During the recent Florida wildfires, including the 344 Fire in south Miami-Dade County, EOSDA LandViewer was used to assess the damage caused by the fires. The platform made it possible to track visible changes in vegetation and land cover through updated satellite imagery. What’s more important, the EOSDA LandViewer allowed to see beyond visible light. Where human eyes see only smoke and flame, this satellite-based platform analyzes specific light wavelengths that reveal burn severity with the highest precision. The key to this insight is the Normalized Burn Ratio (NBR) index.
This index helps detect burn severity by comparing how vegetation reflects near-infrared (NIR) and shortwave infrared (SWIR) light. Nearly intact vegetation reflects more near-infrared light and less short-wavelength light, whereas burned regions show the opposite pattern. This determines the three levels of NBR values:
- high positive values mean healthy, green vegetation;
- near zero values mean dry or sparse vegetation;
- negative values mean sparse vegetation and likely burned or exposed soil.
This index allows fire management officers, scientists, and eco-activists to estimate burn severity and clearly map the affected areas. NBR values usually go back to normal in pine woods within a few months, but visible damage to cypress wetlands can last for years. Knowing this, it’s easy to set realistic recovery timelines and prioritize restoration efforts.
By combining NBR with the Normalized Difference Vegetation Index (NDVI) and natural color layers, EOSDA LandViewer users can see a full picture of the fire’s aftermath. With these professional-grade, daily updated satellite images accessible through an intuitive interface, the platform enables Florida’s fire management teams to operate faster and smarter throughout the state’s increasingly fire-prone environment.
Photo at top: Pixabay via Pexels


