


Key Highlights
- 2.20 fatal work injuries per 100,000 workers were recorded in Washington, the seventh-lowest rate of any state in the country and roughly 25% below the national average of 2.94, according to BLS data.
- 459 workers died on the job in Washington between 2020 and 2024, an average of 92 deaths a year, or roughly one fatal workplace injury every 95 hours.
- Washington’s fatality count fell to a five-year low of 73 in 2021, then climbed to a peak of 104 in 2022 and stayed elevated through 2024, ending at 102.
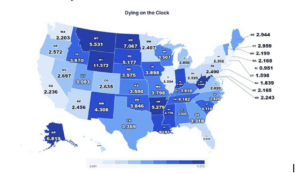
Washington ranks among America’s ten safest states for workplace fatality rate while supporting one of the larger workforces in the West. With over 4 .1 million workers, Washington averages 92 fatal workplace injuries a year . Still, its per-capita rate of 2.20 per 100,000 is roughly 25% below the national average, ranking seventh among the ten states with the lowest workplace fatality rates in America.
According to a new analysis by DeHoyos Accident Attorneys , the study combined Bureau of Labor Statistics Census of Fatal Occupational Injuries data for 2020 through 2024 with U.S. Census Bureau workforce figures from Table DP03 to calculate a five-year average annual fatal injury rate per 100,000 workers in every state.
Washington Ranks Among the 10 Safest States for Workplace Fatality Rate
State |
Employed Workforce (2024) |
Avg. Annual Fatal Injuries (2020 to 2024) |
Fatal Injuries per 100,000 Workers |
Rank |
|
Rhode Island |
610,041 |
5.8 |
0.95 |
1 |
|
Connecticut |
2,002,571 |
32.0 |
1.60 |
2 |
|
New Jersey |
5,145,349 |
94.6 |
1.84 |
3 |
|
Delaware |
535,706 |
11.6 |
2.17 |
4 |
|
Massachusetts |
3,994,387 |
86.6 |
2.17 |
5 |
|
New Hampshire |
791,352 |
17.4 |
2.20 |
6 |
|
Washington |
4,167,685 |
91.8 |
2.20 |
7 |
|
California |
20,454,381 |
457.4 |
2.24 |
8 |
|
Maryland |
3,397,200 |
76.2 |
2.24 |
9 |
|
New York |
10,284,583 |
236.8 |
2.30 |
10 |
Washington’s rate of 2.20 per 100,000 workers is the 7th lowest in the country, effectively tied with New Hampshire at 2.20 and sitting just below California and Maryland at 2.24. Despite operating a workforce nearly seven times larger than Rhode Island, Washington posts a rate only 2.3 times higher than the country’s safest state. The state’s rate also runs roughly 25% below the national average of 2.94. Eight of the ten safest states sit in the Northeast or Mid-Atlantic, making Washington and California the two Western outliers in this group.
Washington’s Year-by-Year Fatal Workplace Injuries (2020 to 2024)
Year |
Fatal Injuries |
Rate per 100,000 Workers |
Change from Prior Year |
|
2020 |
83 |
1.99 |
Baseline |
|
2021 |
73 |
1.75 |
12.0% decrease |
|
2022 |
104 |
2.50 |
42.5% increase |
|
2023 |
97 |
2.33 |
6.7% decrease |
|
2024 |
102 |
2.45 |
5.2% increase |
Washington’s fatality count fell to a five-year low of 73 in 2021 before climbing to a peak of 104 in 2022, then held near that level through 2024, ending at 102. The 2022 peak marked a 25.3% jump from the 2020 baseline of 83 deaths and produced a rate of 2.50 per 100,000 workers, above the state’s five-year average of 2.20. The 2024 total of 102 deaths keeps the rate at 2.45, still well below the national average of 2.94. The elevated counts from 2022 onward reflect sustained activity across Washington’s construction, transportation, and natural-resource industries, though the state’s overall rate remains among the lowest in the country given the size of its labor pool.
Methodology
The analysis combined U.S. Bureau of Labor Statistics Census of Fatal Occupational Injuries (CFOI) state-level reports for calendar years 2020 through 2024 with U.S. Census Bureau American Community Survey Table DP03 estimates of the employed workforce for 2024. For each state, annual fatal work injury counts were averaged across the five years, then divided by the state’s 2024 employed workforce and multiplied by 100,000 to derive the fatal injury rate per 100,000 workers. States were ranked from highest to lowest rate. Regional groupings follow U.S. Census Bureau definitions for the Northeast, Midwest, South, and West. BLS CFOI figures for the most recent year are preliminary and may be revised in subsequent releases.
Data Sources
●U.S. Bureau of Labor Statistics, Census of Fatal Occupational Injuries (CFOI), State-Level Reports 2020 to 2024: https://www.bls.gov/iif/state-data/fatal-occupational-injuries-in-alabama-2024.htm
●U.S. Census Bureau, American Community Survey, Table DP03: Selected Economic Characteristics (2024): https://data.census.gov/table/ACSDP1Y2024.DP03?q=employment+by+state
●Research Dataset: https://docs.google.com/spreadsheets/d/1j7d709LNzo-vnxvJFsW6CmgIFv_BYTpV4qfZjU7iEow/edit?gid=261826248#gid=261826248
●Study by: https://www.dehoyosinjury.com
About DeHoyos Accident Attorneys
DeHoyos Accident Attorneys is a Houston-based personal injury law firm that represents clients in vehicle collisions, slip-and-fall disputes, dog bites, and wrongful death cases. The firm, led by Ryan A. DeHoyos, prioritizes client care, aggressive advocacy, and maximizing compensation across Greater Houston.
Photo: Nelson Axigoth via Pexels
CLICK HERE TO DONATE IN SUPPORT OF DCREPORT’S NONPROFIT MISSION
