



KEY HIGHLIGHTS
• Washington ranks tenth nationwide with $10.28 million in road spending per traffic death, 1.4 times the national average of $7.4 million.
• Among five Pacific and Western states, Washington leads: its spending per death is $2.85 million higher than Idaho ($7.43 million).
• Washington recorded 730 traffic fatalities in 2024 alongside a $7.51 billion road budget, while 9 states with comparable budgets ($3 billion–$12.5 billion) averaged 654 fatalities, 0.9 times Washington’s toll.
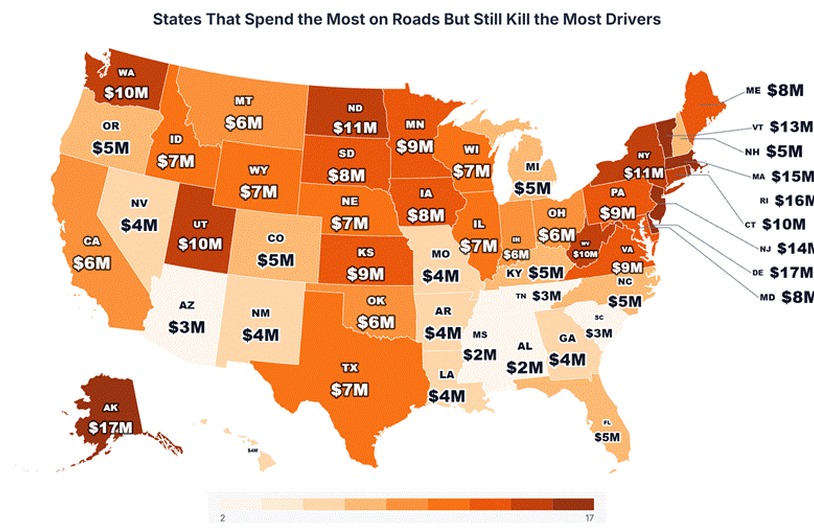
In 2024, Washington disbursed $7.51 billion on its road network, covering construction, maintenance, administration, and safety programs. With 730 traffic fatalities recorded statewide, the Evergreen State achieved a spending-per-death figure of $10.28 million, ranking tenth in the nation and 1.4 times the 50-state average of $7.4 million.
To quantify the relationship between road investment and traffic fatalities, an analysis by Grigor Law Injury & Car Accident Lawyers drew on two federal datasets from the Federal Highway Administration’s Highway Statistics 2024 series: Table SF-2 (state highway agency disbursements) and Table FI-20 (persons fatally injured in motor vehicle crashes). Each state’s total road budget was divided by its total traffic fatalities to produce a spending-per-death figure, and all 50 states were ranked from highest spending per death (best outcome) to lowest (worst outcome).
Washington Ranks Tenth: The 10 States With the Highest Spending per Traffic Death
|
Rank |
State |
Road Budget (2024) |
Traffic Fatalities (2024) |
Spending per Death |
|
1 |
Delaware |
$2.15 billion |
126 |
$17M |
|
2 |
Alaska |
$1.18 billion |
70 |
$17M |
|
3 |
Rhode Island |
$0.83 billion |
52 |
$16M |
|
4 |
Massachusetts |
$5.57 billion |
363 |
$15M |
|
5 |
New Jersey |
$9.63 billion |
670 |
$14M |
|
6 |
Vermont |
$0.78 billion |
59 |
$13M |
|
7 |
New York |
$12.49 billion |
1,101 |
$11M |
|
8 |
North Dakota |
$0.97 billion |
90 |
$11M |
|
9 |
Connecticut |
$3.21 billion |
310 |
$10M |
|
10 |
Washington |
$7.51 billion |
730 |
$10M |
All 10 top-ranked states earn the study’s Green verdict, each spending more than $10 million per traffic death, well above the 50-state average of $7.4 million. Washington, at Rank 10, spends $10.28 million per death, trailing Connecticut ($10.34 million) by $59,564 and outperforming West Virginia ($9.84 million) by $438,116.
Looking at the study, Chrissy Grigoropoulos, Founding Partner of Grigor Law Injury & Car Accident Lawyers, commented:
“Washington’s tenth-place ranking makes it the top-performing state in the entire West region. While the West as a whole posts a below-average spending-per-death figure, Washington’s outcome is 1.5 times the regional average. That gap highlights how much variation exists even within a single region, and it underscores the role that state-level policy and investment priorities play in determining outcomes.”
Washington vs. Its Pacific and Western Neighbors: The Top Performer in the West
|
State |
Fatalities (2024) |
Persons Injured (2024) |
Road Budget (2024) |
Spending per Death |
Rank |
|
Washington |
730 |
428 |
$7.51 billion |
$10,282,507 |
10 |
|
Oregon |
538 |
247 |
$2.47 billion |
$4,593,515 |
37 |
|
Idaho |
238 |
59 |
$1.77 billion |
$7,432,924 |
21 |
|
California |
3,876 |
2811 |
$21.39 billion |
$5,517,846 |
31 |
|
Montana |
206 |
42 |
$1.26 billion |
$6,100,238 |
27 |
Among the five Pacific and Western states, Washington stands out as the clear leader. Idaho, the next-best performer at Rank 21, spends $7.43 million per death, $2.85 million less than Washington. Oregon, at Rank 37, records 0.7 times as many fatalities on a spending-per-death figure of $4.59 million.
When Budgets Are Comparable, Outcomes Diverge Sharply: Washington vs. 9 States Spending $3 Billion–$12.5 Billion
|
State |
Traffic Fatalities (2024) |
Road Budget (2024) |
Spending per Death |
Rank |
|
Washington |
730 |
$7.51 billion |
$10,282,507 |
10 |
|
Massachusetts |
363 |
$5.57 billion |
$15,338,091 |
4 |
|
New Jersey |
670 |
$9.63 billion |
$14,367,209 |
5 |
|
New York |
1,101 |
$12.49 billion |
$11,341,684 |
7 |
|
Connecticut |
310 |
$3.21 billion |
$10,342,071 |
9 |
|
Virginia |
917 |
$8.42 billion |
$9,179,760 |
13 |
|
Pennsylvania |
1,127 |
$10.04 billion |
$8,909,922 |
14 |
|
Kansas |
339 |
$3.02 billion |
$8,901,811 |
15 |
|
Minnesota |
477 |
$4.24 billion |
$8,897,574 |
16 |
|
Maryland |
578 |
$4.63 billion |
$8,012,844 |
18 |
Among the 9 states spending between $3 Billion–$12.5 Billion on roads in 2024, Washington recorded 730 fatalities, while the group averaged 654 deaths, 0.9 times Washington’s count. Maryland, which spends $4.63 billion, recorded 578 fatalities and ranks 18th nationally at $8.01 million per death.
The Regional Divide: Washington Outperforms Its Own Census Region by 1.5 Times
|
Region |
No. of States |
Avg. Spending per Death |
Total Fatalities |
Share of National Fatalities |
Total Road Budget |
|
Northeast |
9 |
$11,420,310 |
3,992 |
10.2% |
$44.7 billion |
|
Midwest |
12 |
$7,225,876 |
7,473 |
19.1% |
$47.9 billion |
|
West |
13 |
$6,746,975 |
8,888 |
22.7% |
$50.3 billion |
|
South |
16 |
$5,812,149 |
18,854 |
48.1% |
$95.5 billion |
The U.S. Census Bureau classifies Washington in the West region, which recorded 8,888 traffic fatalities in 2024, accounting for 22.7% of the national total, with an average spending per death of $6.75 million. Washington’s $10.28 million per death is 1.5 times the West’s average. The South, by contrast, recorded 48.1% of all fatalities while posting the lowest regional average at $5.81 million per death.
Methodology
This analysis examined 2024 road budget disbursements and traffic fatality counts for all 50 U.S. states, using data published by the Federal Highway Administration in its Highway Statistics 2024 series. Table SF-2, which reports total state highway agency disbursements covering construction, maintenance, administration, and other costs, provided the road spending figures. Table FI-20 reports persons fatally and non-fatally injured in motor vehicle crashes, and the traffic fatality and injury figures come from it. For each state, total road disbursements were divided by total traffic fatalities to calculate a spending-per-death figure. The states then had ranks assigned from highest spending per death (Rank 1, best outcome) to lowest (Rank 50, worst outcome). A three-tier verdict system classifies each state: Green for spending over $7 million per death (22 states), Yellow for $3 million to $7 million per death (25 states), and Red for under $3 million per death (3 states).
Data Sources
• Road spending data: Federal Highway Administration, Highway Statistics 2024, Table SF-2: https://www.fhwa.dot.gov/policyinformation/statistics/2024/sf2.cfm
• Traffic fatalities and injuries data: Federal Highway Administration, Highway Statistics 2024, Table FI-20: https://www.fhwa.dot.gov/policyinformation/statistics/2024/fi20.cfm
• Research Dataset: https://docs.google.com/spreadsheets/d/17HZnaV1qAG7RZkPwWN419sQbEZH5luqGFrTksU1Uu-w/edit?gid=0#gid=0
• Research by: https://grigorlaw.com/
About Grigor Law Injury & Car Accident Lawyers
Grigor Law Injury & Car Accident Lawyers is a premier New York “all injury” law firm representing clients in personal injury, car accidents, workers’ compensation, and no-fault claims.
CLICK HERE TO DONATE IN SUPPORT OF DCREPORT’S NONPROFIT MISSION
